T. Bailey Asset Management Limited do not provide advice to private individuals.

The information contained on this website is intended to provide information about our products and services and is not intended as investment advice. It is important that you do not rely upon its content to make investment decisions without seeking independent advice.

This website is intended for United Kingdom professional investors and advisers only. Please ensure you read the important legal information.

28 February 2025: Weekly Update – Europe Rebounds as US Sentiment Weakens

Weekly Update
Global Equities

European markets outperformed as investors grew more cautious on the US outlook following weaker consumer confidence data and continued policy uncertainty.

The balance of political policy uncertainty when comparing the US with Europe has seen a notable shift since the 2024 US Presidential election. Sentiment within the US is showing early signs of turn turning down as government induced policy uncertainty weighs on consumers and corporates. The Conference Board this week reported its biggest monthly decline in US consumer confidence since 2021.

In contrast, the results of the German election at the start of the week proved sufficient to fashion a stable government (albeit through coalition) that that can respond to US tariff threats. Increasing defence spending is also on the cards, representing as much as 1% German GDP.

Equity markets have reflected such changes over recent weeks with the US, in aggregate, underperforming.
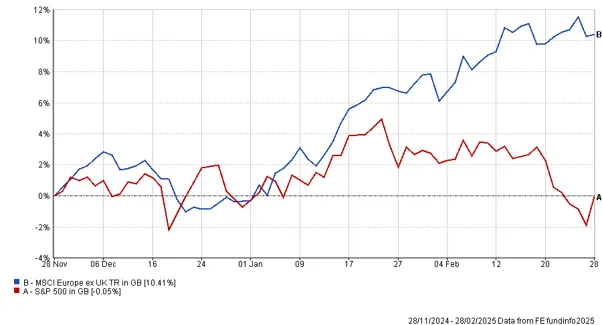
3-Month Performance: Europe ex UK and US equities

Picture6

Source: FE Analytics. Total return, GBP terms.

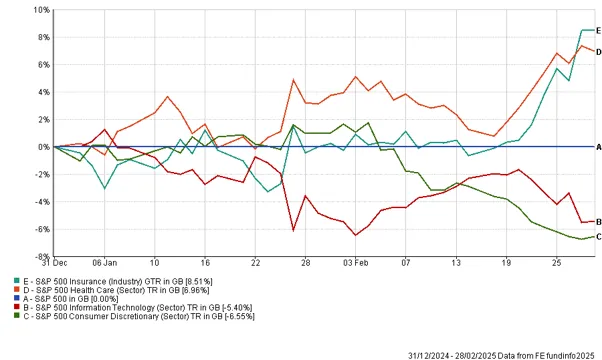
However, the detail within the US is varied. TBAM’s investment themes currently emphasise the healthcare and insurance sectors, which have shown resilience compared to the highly valued information technology and consumer discretionary sectors. These latter sectors are underrepresented in the TBAM funds of funds, despite constituting a significant portion of US equity market indices.

3-Month Relative performance of selected US equity sectors

Picture7

Source: FE Analytics. Total return relative to the S&P 500 index.