When the world changed gear
The largest energy supply disruption in the post-war era: US and Israeli military action against Iran escalated sharply through March, closing the Strait of Hormuz to commercial shipping for the first time in living memory. The International Energy Agency described it as the largest disruption in the history of the global oil market. Brent crude ended the month above US$110 per barrel – its largest monthly gain on record.
A sharp reversal of a strong start to the year: The T. Bailey funds fell during March, with January and February’s gains – built on the Asia and emerging market tilt – largely given back in the month.
Central banks facing an impossible bind: The Federal Reserve held rates but signalled only one further cut for 2026; the Bank of England took cuts off the table; the ECB held firm. All three face the same dilemma – energy-driven inflation arriving just as growth is deteriorating.
The AI de-rating continued quietly in the background: Application software stocks had already fallen around 25% from the start of 2026 before the oil shock hit, as investors grappled with the disruption AI agents pose to established software models. March did not resolve this story; it simply overshadowed it.
March was the month that a risk many had been watching from a distance arrived at full force. The US and Israeli military campaign against Iran, launched at the end of February, escalated into something far more consequential than most anticipated. The Islamic Revolutionary Guard Corps declared the Strait of Hormuz closed – a waterway that in normal times carries roughly a fifth of global oil supplies and a substantial share of liquefied natural gas (LNG) flows. Qatar shut down LNG output entirely, warning that restoring production would take weeks even when a decision to resume was made. Iraq cut around 1.5 million barrels per day as regional storage filled and export routes seized shut. Brent crude, which had closed February in the low US$70s per barrel, pushed above US$90 the following week.
The energy shock was not limited to oil. European natural gas prices surged sharply, with the Dutch TTF benchmark briefly approaching €61 per megawatt-hour, nearly double its level at the start of the conflict, as buyers scrambled to replace Qatari LNG.
For Europe and energy-importing Asia, the combination of higher oil and gas costs represented a genuine terms-of-trade shock rather than a temporary market disruption.
What followed was a month of disorienting swings. Brent briefly spiked towards US$120 on the night of 9 March before crashing back below US$90 within hours, after President Trump described the war as ending “very soon.” Within days Iran had effectively re-closed the Strait and oil was back above US$100. On 19 March, strikes on Qatar’s Ras Laffan LNG hub – which handles around 17% of the country’s export capacity – sent energy prices surging again, triggering a 25-35% jump in European gas prices in a single session. The OECD cut its 2026 world growth forecast to 2.9%. The month ended with Brent above US$110, its largest monthly gain on record.
Oil Futures Contracts: ICE UK Brent, settlement price, US$/bbl
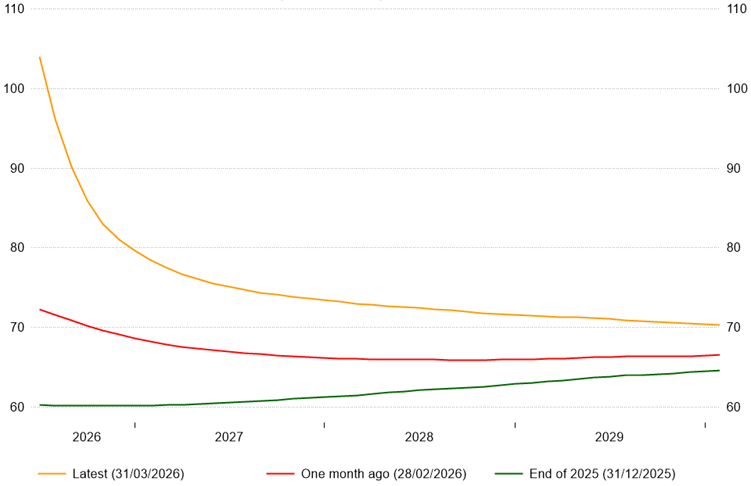
Source: LSEG Workspace.
Underneath the noise, the oil futures curve told the most important part of the story. Near-term contracts priced acute scarcity; longer-dated contracts continued to embed the assumption that disruption ultimately proves temporary, with prices a year out pointing materially lower. In effect, the market still prices an off-ramp, albeit an uncomfortable one. That view was reinforced on the final day of the month, after the final valuation point for the T. Bailey funds for March, when the S&P 500 recorded its best single session in nearly a year after President Trump signalled a willingness to end the campaign and Iran’s president expressed the “necessary will” for peace. Oil bounced back sharply the following day as rhetoric hardened again. The episode clearly illustrates why remaining invested through geopolitical volatility matters: recoveries arrive without warning, and missing them compounds quickly.
The central bank bind
The energy shock has created a genuinely difficult position for policymakers. “Stagflation” is back in the headlines, and with it comes an instinct to reach for the 2022 playbook: sell bonds, sell growth, brace for rate hikes. Just over half of professional asset allocators in the latest Bank of America Global Fund Manager Survey expect stagflation as their base case over the next twelve months. We think this is a misdiagnosis. The 2022 inflation shock had specific characteristics worth remembering. Prices were accelerating at their fastest pace in forty years, against a backdrop of genuinely resilient demand – households drawing down pandemic savings, corporate balance sheets refinanced at near-zero rates, labour markets at historic tightness. Aggressive monetary tightening was the correct response. What is happening now is structurally different. US consumer prices in February held at 2.4% year-on-year, i.e. persistent, but not accelerating. More tellingly, US non-farm payrolls fell by 92,000 in February and unemployment rose to 4.4%, evidence that domestic demand was already fragile before the energy shock arrived. In the UK, February CPI held at 3.0%, with core at 3.2%; the OECD has since raised its UK inflation projection to 4% for 2026, but it has done so whilst simultaneously cutting its UK growth forecast to just 0.7%, the largest downgrade to any G20 economy. This is clearly not the overheating economy of 2022.
The Bank of England’s unanimous hold at 3.75% in March is less a signal that 2022 is repeating itself than a reflection of how trapped the Monetary Policy Committee is – unable to cut without appearing to capitulate to inflation and unable to tighten without pushing a stagnating economy further into difficulty. Real-economy consequences are evident: UK lenders withdrew hundreds of mortgage products through the month as gilt yields and swap rates jumped, tightening borrowing conditions for households at precisely the moment energy bills are set to rise again. Money markets briefly priced four rate hikes in the UK for the remainder of 2026. We think that is excessive. An environment in which growth disappoints materially – and the OECD’s assessment suggests it will – is one where rate expectations ultimately have to fall back, and with them yields. The path there will not be smooth, and the UK’s fiscal vulnerabilities are real. But holding some duration is a considerably more defensible position than the 2022 playbook would suggest.
UK Yield Curve (%) compared with one month ago
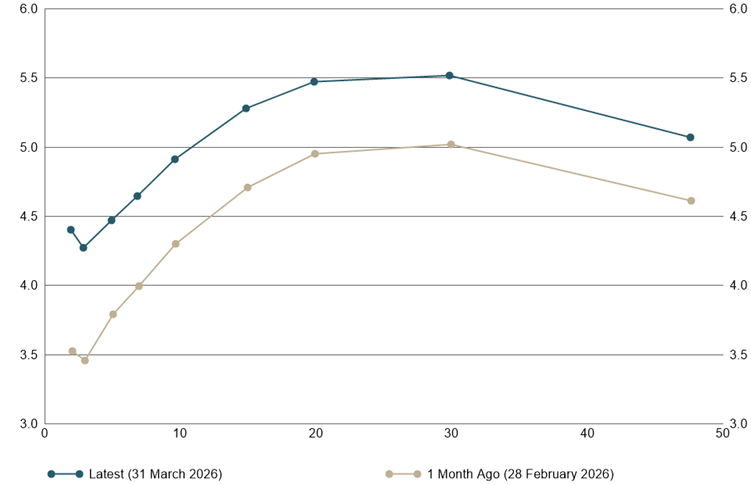
Source: LSEG Workspace.
How the portfolios fared
There was no easy place to hide in March and we will not pretend otherwise. What the diversification within the T. Bailey portfolios did was reduce the severity of losses, but in a month when the dollar surged, real yields rose and oil prices dominated market moves, virtually every asset class fell.
The exits from European and Japanese passive equity exposure completed in February – which redeployed capital into emerging markets and thematic positions – reduced the portfolios’ sensitivity to energy-importing regions at the margin, though the honest assessment is that holding more energy-related assets would have served investors better over the worst of the disruption. The rotation into emerging markets added to near-term headwinds given the region’s sensitivity to energy import costs and a stronger dollar, though our emerging market exposure sits primarily with an active manager – a distinction that proved meaningful by month end.
Within equities more broadly, energy-importing regions bore the worst of the sell-off. The Baillie Gifford Pacific Fund fell 14.2%, reflecting Asia’s acute vulnerability to higher energy costs and a stronger dollar. JK Japan and Zennor Japan fell 11.8% and 9.5% respectively. These are meaningful losses in absolute terms, though both funds retain strong twelve-month performance records and the structural case for owning Japan and Asia has not changed. The Merlin Fidelis Emerging Markets Fund fell 7.8%, outperforming the emerging market index by 3.6%, a reminder that in a sharp, differentiated sell-off, where a manager is not invested matters as much as where they are.
The funds’ thematic holdings also fell, though for the most part less acutely. Polar Capital Healthcare Opportunities fell 5.0%: in normal circumstances a defensive holding, but rising real yields and dollar strength weighed even on non-discretionary sectors. Polar Capital Insurance fell 3.4%. WS Havelock Global Select fell 4.9% and Ranmore Global Equity fell 5.8%, though both outperformed the IA Global sector average. Copper fell 6.1% as growth concerns cut across the energy-shock narrative; the strategic rationale for holding it is unchanged, but March was not its month. The Asia and emerging market tilt that drove January and February’s gains worked against the funds in March, and all three ended the quarter behind their absolute return benchmarks.
In the multi-asset funds, the clearest sources of ballast were among the absolute return holdings. TM Fulcrum Diversified Core Absolute Return fell just 2.8% in a month when equities fell around 8%, and Man Credit Opportunities fell less than 0.3% – demonstrating in practice what these strategies are held for.
Gold was the month’s most counterintuitive story. Despite an active military conflict in the world’s most important energy corridor, the iShares Physical Gold ETC fell 10.0%. A mechanical explanation is a surging dollar and rising real yields suppressing gold’s dollar price. Nonetheless, the strategic rationale for having exposure to the metal is undiminished and the same ETC has returned 44.6% over the past twelve months. The buyers driving that performance have not been tactical traders responding to geopolitical headlines but emerging-market central banks accumulating gold deliberately and at scale as part of a structural move away from US dollar reserves, a signal about long-term monetary risk that short-term price moves do not alter. Gold, held at around 5% of the multi-asset funds, remains a conviction position.
Chrysalis Investments fell a further 11.0%, adding to what has been a deeply frustrating sequence as governance uncertainty, private-market de-rating and growth headwinds compound. It remains in the portfolio, sized to reflect its risk profile, but we will not minimise the drag it has represented.
Major regional equity indices: Year-to-date
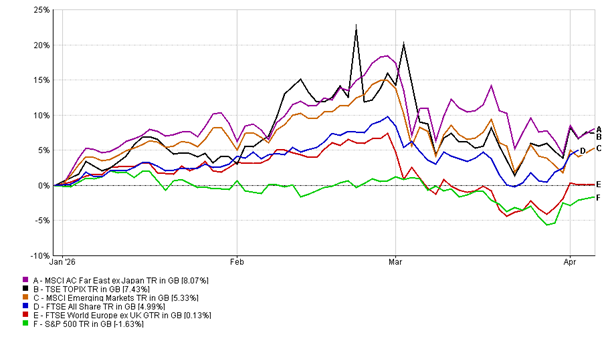
Source: FE Analytics. Total return, GBP Terms.
Looking ahead
Our base case for the coming weeks remains one of de-escalation. The political incentives for both sides point towards an exit: the US administration faces elections later this year against a backdrop of clear voter dissatisfaction with the cost of living, and a prolonged energy squeeze would compound that pressure considerably. Iran has maintained a plausible off-ramp allowing for selective vessel passage through the Strait of Hormuz and framing its actions as conditional.
The broader picture is more nuanced. For the rest of the world, history suggests that major energy shocks, whilst painful, tend to force adjustments that leave economies more resilient in their aftermath. Accelerating investment in renewables, nuclear and supply diversification that reduces vulnerability to any single corridor or exporter is the likely consequence.
For the months and years ahead, the events of March have reinforced rather than challenged the positioning of the T. Bailey portfolios. The case for owning fewer US assets was already building before this conflict began. The Strait of Hormuz crisis has strained the petrodollar architecture – the arrangement by which Gulf energy is priced in US dollars, recycled into US Treasuries and underpinned by American security guarantees – at a moment when moves to settle crude in alternative currencies represent an early but meaningful challenge to that system. Key European allies declined to participate in military operations around the Strait, stressing that the conflict fell outside NATO’s defensive remit, making future broad coalitions harder to assemble. And the US entered 2026 with deficits on an unsustainable trajectory; war spending, the inflationary impulse that slows Federal Reserve easing, and higher debt-servicing costs all argue for a structurally higher risk premium on US assets. It is no accident that the S&P 500 – which by month end had confirmed a correction of more than 10% from its October peak – was the worst-performing major equity region year to date.
The deliberate tilt towards Asia and emerging markets via active managers – JK, Zennor, Merlin Fidelis, Baillie Gifford – reflects our conviction that global growth and capital flows are becoming more multipolar, and that the concentration risk embedded in US-heavy portfolios is rarely compensated adequately. The thematic emphasis on businesses with genuine pricing power in sectors such as healthcare, insurance, water and infrastructure matters more in an inflationary environment than it did in the benign decade that preceded it. Short-duration bonds provide income without excessive term-premium risk, whilst the case for extending duration gradually grows as extreme rate-hike expectations fade. Gold and copper remain conviction positions, and the absolute return strategies continue to provide ballast when traditional asset-class correlations break down. The world has a strong tendency to return to normal; we remain confident that it will.